


SPX, S&P 500 Talking Points:
- It was an aggressive sell-off that engulfed U.S. equities as SPX put in four consecutive weekly losses for the first time since last August. But the Friday before last showed a strong reaction as buyers responded to lows by pushing price back up to a key level, and last week saw continued defense of that price to produce the first green weekly bar since the sell-off began.
- Recession fears were a big push point as was tariff confusion, but the FOMC rate decision last week helped to produce a bit of calm and in-turn SPX held on to a key zone of support, the ‘s2’ zone looked at in the 2025 forecast and in my top trade idea for 2025.
- Helping the push was weekend comments from President Trump around leeway on tariffs, which would be one of the first supportive items on the topic that we’ve heard from the executive branch. But – this does highlight that he might be willing to take a softer stance on the topic in the near-term with reciprocal tariffs set to come into play on April 2.

U.S. equities are staring the week on a more positive note after last week saw the four consecutive red week streak broken. Sellers came on fast in late February and pushed prices through the first half of March. But last week was very much a change-of-pace as the weekly bar printed as both an inside bar and a spinning top. Perhaps more important than the candle itself was where it printed – as it was the same 5638 level that held support throughout the week.
Bulls weren’t exactly able to take advantage of the situation, however, as a large OpEx on Friday kept prices in a churning range after the FOMC rate decision, and the gap from the prior week ultimately helped to hold resistance. But so far this week bulls are back in a big way, forcing a bullish gap and pushing into that prior bearish gap from a couple weeks ago as recovery themes take further hold.
SPX Weekly Chart
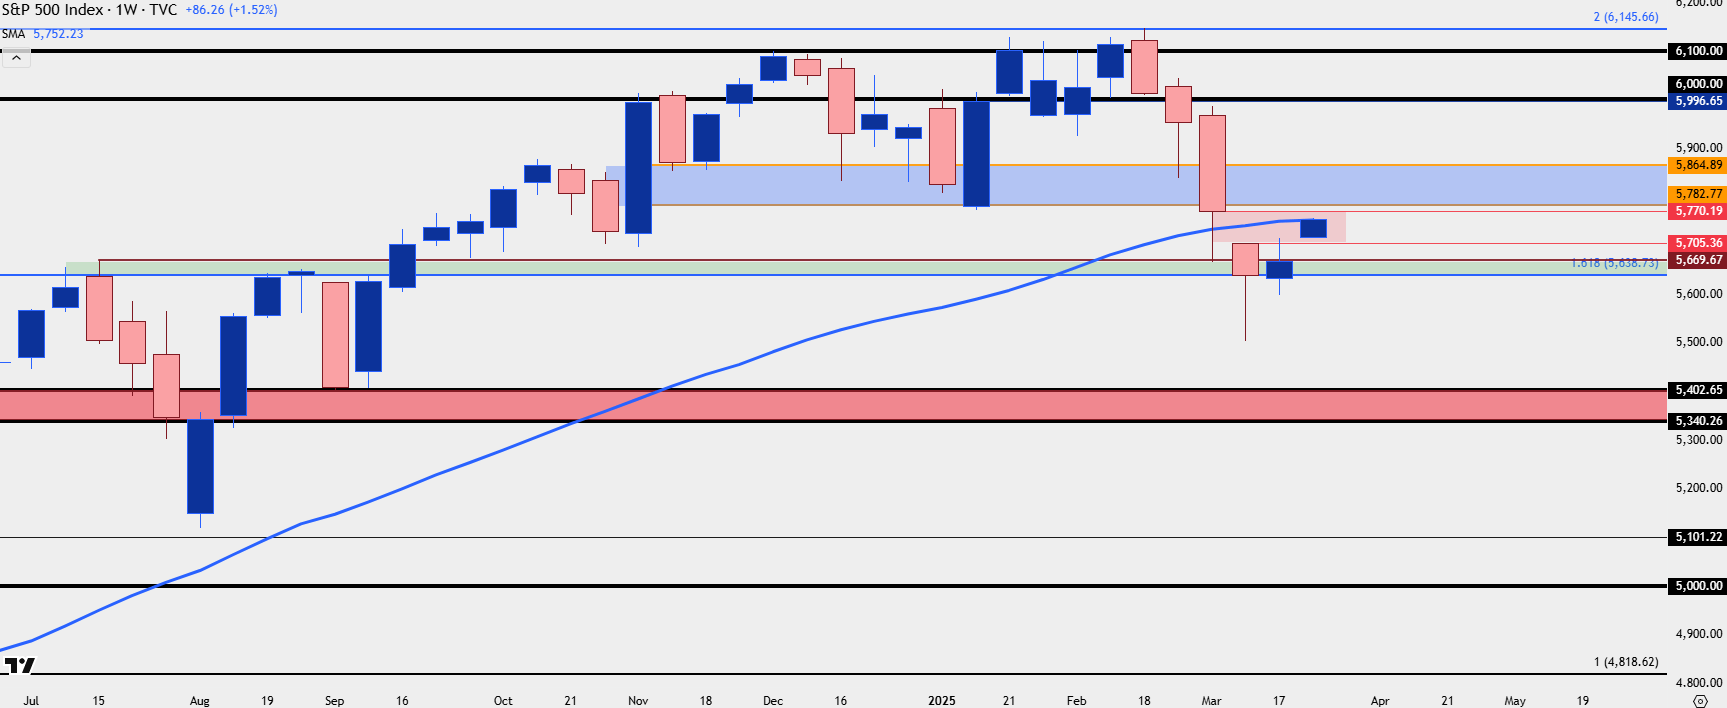 Chart prepared by James Stanley; data derived from Tradingview
SPX Daily
Also, a change of pace was the fact that four days last week were green, with Tuesday being the exception. But three of those days saw highs develop at the bottom of the prior weekly gap, around the 5702 level.
This morning’s open was well-above that, however, and buyers have already pushed into the 200-day moving average which is helping to hold the high, as of this writing. The top of that prior gap runs up to 5770 and that’s what I’m looking to for next resistance. Above that, it’s the prior election gap, which had come in as support in January before bulls were able to press up to fresh all-time highs.
For support – this week’s gap is now that spot that bulls need to defend to retain control, and there’s reference to bigger picture levels given last week’s hold in the ‘s2’ zone that I had looked at in the 2025 forecast. This runs from 5638 to 5670, with the former price functioning as the 61.8% projection from the 2022 sell-off. More notable than that, however is that the price came into hold the highs last July; and the swing high from that episode was at 5670 which helps to establish the top of that support zone.
SPX Daily Price Chart
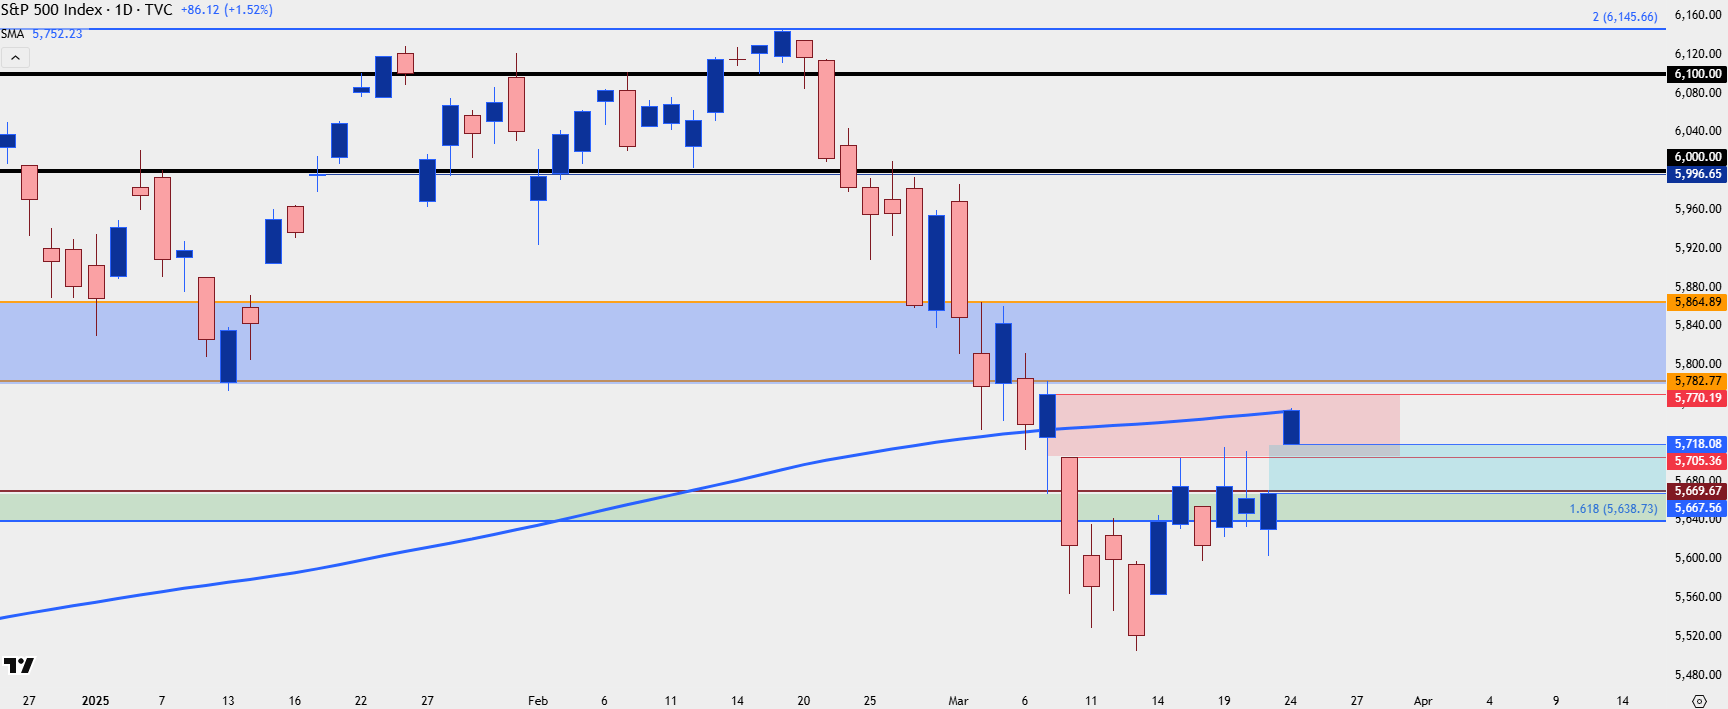 Chart prepared by James Stanley; data derived from Tradingview
S&P 500 Shorter-Term
If you’re bearish, now is the time to be interesting as prices have bounced up to some possible resistance as taken from prior support. Interestingly, it seems that the headlines and perhaps even the commentary on social media tends to bearish when prices are down and bullish when prices are up, such as we have now. But for a trader looking to implement strategy – that can be a recipe for selling bottoms and buying tops, as those moves are already well accounted for by the time the crowd can show excitement.
Perhaps the more interesting scenario here is if bears can’t take greater control – if we do see bulls pushing higher. But, if looking to establish bullish exposure, similarly, now may not be the most opportune time following a strong gap from a big area of support potential.
Instead, waiting for a pullback to support could be a more cautious manner to approach the move. And given the wide gap from the weekly open, there would be an ideal spot for bulls to show their hands should a pullback develop from the 5750 level at the 200-dma, or the 5770 level at the top of the gap from earlier in March.
For support, I’m tracking 5705 as this was a level of resistance for three days last week, and ideally, pullbacks would excite buyers enough to come in and defend that support level. Below that, 5770 remains of interest as that was last week’s close and Friday’s swing high. And below that, 5638 still looms large.
SPX Four-Hour Price Chart
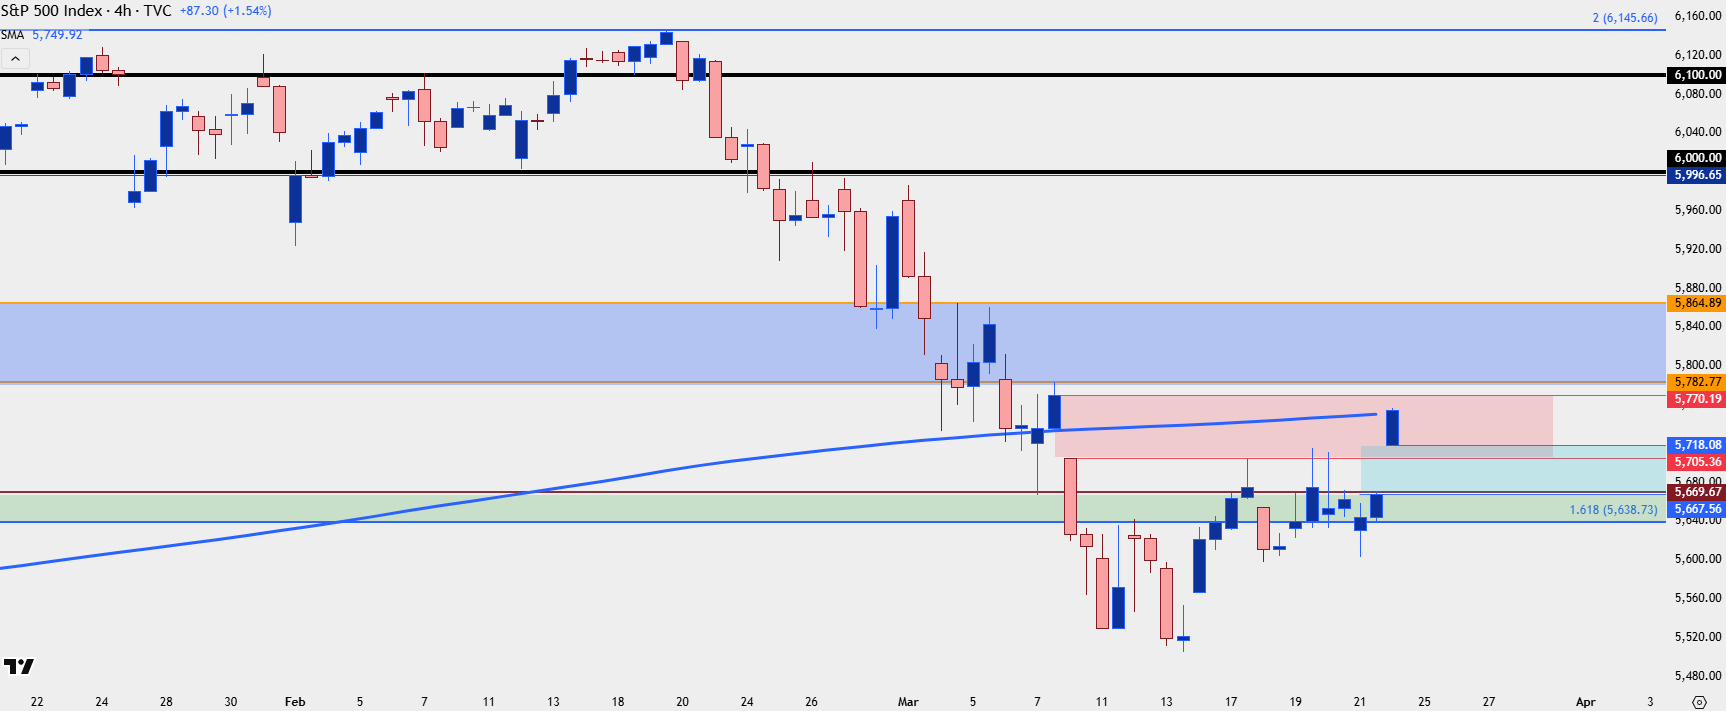 Chart prepared by James Stanley; data derived from Tradingview
--- written by James Stanley, Senior Strategist


Latest market news
March 26, 2025 09:18 AM
March 26, 2025 08:56 AM
March 26, 2025 04:01 AM
March 26, 2025 12:40 AM
March 25, 2025 08:49 PM
March 25, 2025 07:05 PM
Latest articles


Yesterday 10:12 PM

Yesterday 07:26 PM